Wildfire Visualizations in the Cheakamus Community Forest
- Nick Soverel

- Nov 16, 2025
- 4 min read
Updated: Nov 18, 2025
The Cheakamus Community Forest partnered with Frontera Forest Solutions to understand how climate change could influence future wildfire behaviour around Whistler. Using long-range climate projections and more than a thousand simulated fire seasons, the team transformed flat threat maps into animated, interactive visualizations that offer clearer insight for forest management, emergency planning, and public engagement.

Climate Risk Assessment and Wildfire
In 2025, the Cheakamus Community Forest (CCF) embarked on the creation of a climate resilience framework towards long-term sustainable forest management. To this end, the CCF contracted Frontera Forest Solutions, Inc. (Frontera) to develop a climate change risk assessment. The risk assessment identified wildfire as the most significant climate impact to forests and forest management in the CCF.
To better understand historical, predicted near-term, and predicted long-term wildfire behaviour, Frontera used a novel approach to wildfire modelling. This involved projecting climate patterns over a long time period and employing BurnP3+ as the primary landscape wildfire model. Frontera used BurnP3+ as a digital playground, allowing the model to run over 1,000 fire season simulations, then aggregating the results of those simulations to discern potential wildfire patterns across the CCF and the Resort Municipality of Whistler (RMOW).
Where could wildfire originate within the CCF that could threaten different populated areas within the RMOW?
As the CCF is large and essentially surrounds the RMOW, the team desired to better understand the potential impacts from wildfire events originating from the CCF. This could better inform forest management operations within the CCF as they relate to wildfire fuel management and emergency management.
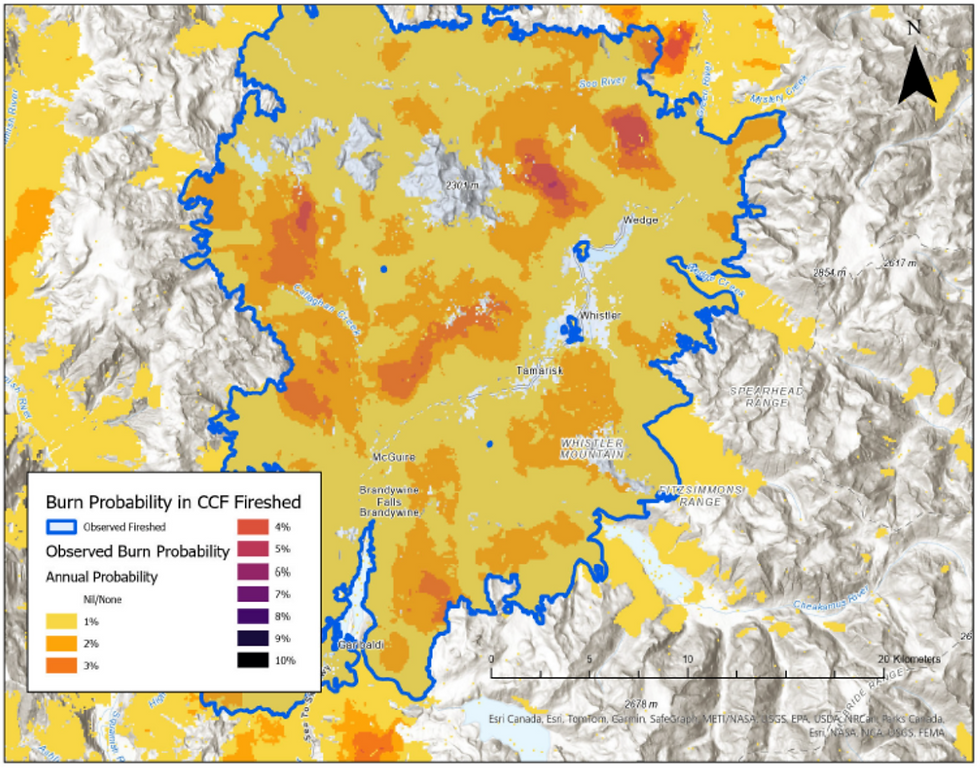
Key information regarding wildfire threat includes: the probability of wildfire ignition, the rate and direction of spread of wildfire, and the head fire intensity of that particular wildfire. This type of wildfire information can be represented as separate raster layer maps or in combination to create formulaic calculations normally called wildfire threat raster maps.
An example map of burn probability is in Figure 1, shown below. These maps will look familiar to community forest managers and consultants as these are typical raster maps produced from a wildfire modelling system.
Wildfire Visualization: From Flat Maps to Animated Visualizations
The team at Frontera wanted to go beyond the flat raster map model to represent wildfire as it naturally behaves: in motion. To do this, we knew we needed a couple of different approaches: 1) modifying the typical BurnP3+ model output data, and 2) animating the spatial data itself.
In order to modify the data for animation, we fine-tuned a method pioneered by the Canadian Forest Service which determines areas that communities should be concerned about in terms of fire spread and fire spread patterns. Borrowing a concept from hydrology, the fireshed concept is a spatial region within which a fire starting has the potential to reach a community of concern (occurring in both extreme and mild scenarios). Borrowing a concept from transportation managers, firesheds encompass all potential modelled fire ‘pathways’ and pathways as they spatially overlap and become ‘highways’ into a community. This approach then models all potential fire highways into the community, predicting which fire highways have the highest probability for community interaction.
In order to animate the fire pathway/highway data, we worked with a computer scientist to come up with ways in which we can innovatively display, symbolize, and animate this information. This allows for rapid identification of these fire highways, rather than requiring land managers interpret static threat maps. Through this collaboration and in working with our team at CCF, we’ve developed two visualizations.
The first visualization uses an ESRI platform called the ‘CCF Wildfire Flow Renderer Visualization’ flowrender, which displays CCF’s wildfire pathway information.. The pathways within flowrender are representations of potential wildfire occurrences and thus a higher aggregation of wildfire pathways is representing a fire highway. This is displayed by those pathways overlapping and becoming thicker and brighter. The blue outline in the visualization is the modelled fireshed boundary described above.
The second visualization is called the ‘CCF Integrated Wildfire Visualization’ (see Figure 3). It has similarities to the first visualization; however, it goes a bit further to provide more information specifically on fire highways, including head fire intensity (HFI) rank (colour of the highway) and highway density (low, moderate, and high density shown with increasing thickness of the lines).
Internal and External Communication
We have found that these visualizations are improving our general understanding of the potential for wildfire events and discerning patterns across the landscape. We have also found these visualizations generate good discussion across different audiences and can be used in internal meetings with emergency managers and other community leaders. We also see potential for these visualizations being used for external public engagement.
The team at Frontera would be happy to discuss these visualizations in more detail or to provide more information on how your community or community forest could benefit from these visualizations.
For more information, please contact us info@fronterasolutions.ca.
Stay Connected
Subscribe to our newsletter to stay updated on the latest industry trends, sustainable forestry practices, and important news from Frontera Forest Solutions Inc.

Frontera Forest Solutions is a forestry consultancy located in North Vancouver, British Columbia. With clients all around Western Canada, Frontera specializes in helping communities develop wildfire resiliency though innovative forest management an urban forestry, grant writing and training and curriculum development.
To explore how we can work with your community, reach out here.


Comments